Sunday 22 September 2013
On holiday
Amongst the madness that has been moving country All Models Are Wrong is taking a sabbatical. If and when things return to approximately normal updates will be made through the usual channels. (Although in the meantime, my (much less time-intensive) quiz blog remains moderately active.)
Monday 20 May 2013
The Fantasy Premier League table
The English Premier League concluded on Sunday and, while there was little to play for for most teams, there was still late drama, ridiculous scorelines, and some even more ridiculous hair.
Sunday also saw the conclusion of the fantasy football season with the Premier League's official game going right down to the wire. Being something of a fantasy football nut myself (and inspired by a question from a friend) I got wondering about how the Premier League table might have looked if it was fantasy, rather than real, points that counted.
In case you're unfamiliar with the wonderful time sink that is fantasy football all you need to know is that (real) footballers score (fantasy) points for various achievements on the pitch. How many points they get depends on their position but as a rule doing things that are good for your team (scoring goals or keeping clean sheets) earn you points while things that are bad for your team (getting booked pr conceding lots of goals) lose you points. Obviously there's rather more to it than that, but those are the basic principles.
It seems reasonable, then, that fantasy points should match up pretty well to real points. To see quite how well I ran the numbers: for every team in the Premier League I totalled up the fantasy points scored by all their players. (The only slight complication was that some players changed club partway through the season, but this only affected a handful of individuals who I dealt with manually.)
Here's how the fantasy table worked out, complete with the ranking differences between this and the real Premier League table. Teams in green gained places in the fantasy world, teams in dropped down, and teams in blue stayed the same (click for big).
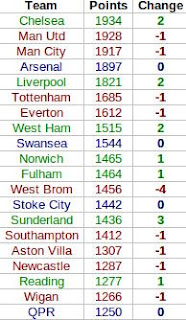
In the fantasy world Chelsea leapfrog both Manchester clubs to take top spot. This seems mainly down to where their goals came from. In this fantasy game a player gets more points for scoring a goal if they're a midfielder than if they're a striker. United's goals mainly came from Wayne Rooney and Robin van Persie - their forwards - while Chelsea profited much more from their midfield with a bulk of their goals coming from Juan Mata, Eden Hazard and, of course, Frank Lampard.
Elsewhere in the table there's not much movement, with only West Brom's fall of four places and Sunderland's rise of three standing out. The reasons for these are less clear (although one should bear in mind how tight the real Premier League table was in these areas), but West Brom did keep relatively few, and Sunderland relatively many, clean sheets.
As a final experiment (and to make this a little bit more statsy) I thought I'd see how well we could estimate a team's fantasy total based just on how many goals they scored and how many times they kept a clean sheet. Fitting a linear model suggested the following equation for estimating fantasy points for a team based solely on these two pieces of information:
Fantasy Points = 718 + 9G + 34C
where G stands for 'goals scored' and C for 'clean sheets kept'. In other words, with this very simple model (which nevertheless explains 97% of the variation in teams' fantasy scores) we find that the average goal is worth nine points, and the average clean sheet is worth 34. (The 718 at the front, meanwhile, is largely down to the fact that players usually earn two points simply for playing the match.)
There's not much more to say that doesn't involve devolving into a rather ludicrous level of fantasy football geekery, so I think I'll leave it at that. Now to work out what to do for the next two football-free months...
Sunday also saw the conclusion of the fantasy football season with the Premier League's official game going right down to the wire. Being something of a fantasy football nut myself (and inspired by a question from a friend) I got wondering about how the Premier League table might have looked if it was fantasy, rather than real, points that counted.
In case you're unfamiliar with the wonderful time sink that is fantasy football all you need to know is that (real) footballers score (fantasy) points for various achievements on the pitch. How many points they get depends on their position but as a rule doing things that are good for your team (scoring goals or keeping clean sheets) earn you points while things that are bad for your team (getting booked pr conceding lots of goals) lose you points. Obviously there's rather more to it than that, but those are the basic principles.
It seems reasonable, then, that fantasy points should match up pretty well to real points. To see quite how well I ran the numbers: for every team in the Premier League I totalled up the fantasy points scored by all their players. (The only slight complication was that some players changed club partway through the season, but this only affected a handful of individuals who I dealt with manually.)
Here's how the fantasy table worked out, complete with the ranking differences between this and the real Premier League table. Teams in green gained places in the fantasy world, teams in dropped down, and teams in blue stayed the same (click for big).
In the fantasy world Chelsea leapfrog both Manchester clubs to take top spot. This seems mainly down to where their goals came from. In this fantasy game a player gets more points for scoring a goal if they're a midfielder than if they're a striker. United's goals mainly came from Wayne Rooney and Robin van Persie - their forwards - while Chelsea profited much more from their midfield with a bulk of their goals coming from Juan Mata, Eden Hazard and, of course, Frank Lampard.
Elsewhere in the table there's not much movement, with only West Brom's fall of four places and Sunderland's rise of three standing out. The reasons for these are less clear (although one should bear in mind how tight the real Premier League table was in these areas), but West Brom did keep relatively few, and Sunderland relatively many, clean sheets.
As a final experiment (and to make this a little bit more statsy) I thought I'd see how well we could estimate a team's fantasy total based just on how many goals they scored and how many times they kept a clean sheet. Fitting a linear model suggested the following equation for estimating fantasy points for a team based solely on these two pieces of information:
Fantasy Points = 718 + 9G + 34C
where G stands for 'goals scored' and C for 'clean sheets kept'. In other words, with this very simple model (which nevertheless explains 97% of the variation in teams' fantasy scores) we find that the average goal is worth nine points, and the average clean sheet is worth 34. (The 718 at the front, meanwhile, is largely down to the fact that players usually earn two points simply for playing the match.)
There's not much more to say that doesn't involve devolving into a rather ludicrous level of fantasy football geekery, so I think I'll leave it at that. Now to work out what to do for the next two football-free months...
Thursday 16 May 2013
Predicting Eurovision finalists: would you beat a monkey?
Over on my quiz blog, I've taken a brief detour into the world of Eurovision, specifically the difficulty of predicting which countries will qualify from this week's semi-finals. The background to this post can be found there, whereas here I'll be going into slightly more detail about the maths behind the results. (And in the unlikely event you've arrived here first, I'd strongly recommend reading the original post first.)
Starting with the first semi-final, the problem is relatively straightforward to summarize: you simply need to pick 10 winners from a field of 16. (To aid intuition, it's helpful to notice that this is equivalent to picking 6 losers from the same field, but in either case the solution is relatively straightforward.)
As always it's a good idea to start simple. To get all 10 correct is a simple matter of choosing the right 10 countries from 16. There are 8,008 ways to choose 10 items from a list of 16 (see here if you're unfamiliar with how we can arrive at this number so effortlessly), so you have a 1 in 8,008 chance of picking all 10 qualifiers if you choose at random. Pretty slim, but not too ridiculous.
Next, say you got 9 correct, how good is that? To answer this we need to know the probability of picking at least 9 qualifiers or, equivalently, the probability of picking exactly 9 or exactly 10. We have the latter already, so what about the former?
We know there are 8,008 different ways to choose the 10 countries we think will go through. The question, then, is how many of these 8,008 ways correspond to having exactly 9 correct predictions. The answer comes fairly intuitively if we imagine trying to deliberately construct a set of 10 predictions made up of 9 winners and 1 loser: we just choose 9 of the 10 countries who qualified and 1 of the 6 who went out. There are 10 ways to choose 9 things from 10, and 6 ways to choose 1 from 6, giving us 10 x 6 = 60 ways to pick 10 countries of which exactly 9 will progress to the final. Adding this to the 1 way that gives us all 10 qulifiers means we're looking at 61 of the 8,008 possible ways to predict 10 countries: our Eurovision-loving monkey has about a 1 in 131 chance of picking at least 9 qualifiers correctly.
This method easily extends to less successful attempts. For exactly 8 correct predictions we need to choose 8 of the 10 winners and 2 of the 6 losers. There are 45 ways to do the former and 15 to do the latter giving us 45 x 15 = 675 ways to get exactly 8 correct. Add this to the 60 ways to get exactly 9, and 1 way to get exactly 10, and we hit 736 out of 8,008, or about a 1 in 11 chance of getting at least 8 qualifiers correct. The method extends downwards for less successful predictions (and you can get the full results table over in the quiz blog post).
The only other question is how to modify this to work for tonight's 17-country semi-final. The same logic applies, and most of you could probably work this out yourself from here. Rather than 10 winners and 6 losers, you're now looking at 10 winners and 7 losers. There are 19,448 ways to pick your 10 qualifiers from the 17 countries, and just 1 of those will give you a full set: you already have less than half the chance to hit a perfect 10 than you did on Tuesday.
What about 9 correct? Applying the same procedure we can easily see that there are still 10 ways to choose 9 of the 10 winners, but there are now 7 ways to choose 1 country from the set of 7 losers. This gives 10 x 7 = 70 ways to get exactly 9 correct qualifiers in the 17-country set-up, or 71 out of 19,448 (1 in 274) ways to get at least 9 qualifiers right on the night. Again, full results can be found on the quiz blog.
That's all there is to it. A neat problem, I think, with a similarly neat solution. It's also an interesting lesson in how easily numbers can deceive: getting 7 out of 10 qualifiers right on Tuesday might have seemed good, but it's the same as identifying just 3 of the 6 losers. You'll have still done (slightly) better than a monkey, but it's probably not quite something to sing about.
Tuesday 12 March 2013
The Pope vote: could it be left to chance?
 |
| Fancy! |
To answer this, we first have to decide how many options each cardinal has to pick from. Strictly speaking, they have 114 choices (you can't vote for yourself, apparently), but in reality there are only a handful of papabili. A quick look at the betting markets suggest that there are three primary contenders: Angelo Scola, Peter Turkson and Odilo Scherer all have odds of around four to one. Canadian Cardinal (one of the less successful superhero franchises) Marc Ouellet is next at eight to one, while the remaining candidates can only really be described as long shots so hopefully can be safely ignored (famous last words).
Let's start simple and assume there are only two options. If every cardinal tosses a coin to decide between, say, Scola and Turkson (one of the less successful 70s detective dramas) then how long could they expect to be admiring Michelangelo's handiwork? In other words, we want to know the chances of tossing a coin 115 times and getting either at least 77 heads or at least 77 tails (we don't care which of them wins, we just want to go home). Conveniently, the chances of the former are the same as the chances of the latter, and so we only need to calculate one of them and then double it. This is a fairly standard problem so I'll spare the details and just tell you that the odds of seeing 77 or more heads from 115 tosses is a pretty minuscule 1 in 5,700, which gives the Coin-tossing Cardinals of the Conclave (one of the less successful prog rock bands) a 1 in 2,850 chance of getting a Pope. With four conclaves a day that works out to, on average, nearly two years of voting before somebody is elected. I hope they packed a change of cassock.
If they have any more candidates to choose from, meanwhile, things get predictably worse. With third-favourite Scherer added to the pool of potential Popes they would be looking at 1,2 billion years in the Sistine Chapel, and if Ouellet got into the mix I'd have to resort to this Wikipedia page.
After Benedict's resignation, some quarters picked up on a prophecy which alleges that the next Pope's pontificate will usher in the beginning of the Apocalypse. If those 115 cardinals are picking at random, we'll be lucky to get that far.
Thursday 14 February 2013
Football formulae: the maths behind the Champions League draw
A somewhat belated follow-up to this post, where I looked at the probability of the draw for the Champions League knockout stage matching the preceding day's rehearsal draw. We have an article for the print magazine in the pipeline, so this is a little short on detail, but there is a surprisingly large amount of interesting stuff behind this problem.
I can (hopefully) be heard discussing a small aspect of this on the BBC's World Service program More or Less this coming Saturday, at 1350 UTC, although I make no guarantees that my segment won't end up on the cutting-room floor.
I can (hopefully) be heard discussing a small aspect of this on the BBC's World Service program More or Less this coming Saturday, at 1350 UTC, although I make no guarantees that my segment won't end up on the cutting-room floor.
Monday 14 January 2013
From the archives: does the best picture win?
 |
| Oscar Mike |
It turned out that average review scores weren't particularly good at predicting the best picture, with just five 'Metacritic favourites' winning in the 18-year period I investigated. Since then, this number has crept up: while the 2011 winner The King's Speech was a mere fourth favourite, last year The Artist became the sixth top-rated movie to actually win.
This year, spy thriller Zero Dark Thirty leads the field, with a Metacritic score of 95. Best Foreign Language nominee Amour is a close second on 93, with a (relatively) big drop down to 86 where three films are lurking in third place. However, it's one of these three - the aforementioned Lincoln - which is currently the runaway favourite with the bookmakers.
It seems, then, that the stage is set for another non-'favourite' to take the top prize. However, should the bookies be proved correct, the makers of Zero Dark Thirty can at least console themselves with this fact: with a Metacritic score of 95 it will become the 'best' losing picture in the last 20 years.
Friday 11 January 2013
Book review: Seeing the bigger picture
Time for another review. I got my hands on a well-presented book full of shiny infographics summarizing various global statistics. Unfortunately it didn't live up to expectations, with rather a lot of 'classic' statistical mistakes lurking in its graphics. (Also, I was relieved to discover at least one other statistically-minded reviewer had similar issues with it.)
Subscribe to:
Posts (Atom)
